My Portfolio
To provide a tangible showcase of my work, I’ve included a portfolio of my most recent projects. Take a moment to explore below, and reach out if you’re interested in learning more about what I have to offer.
2023 Project
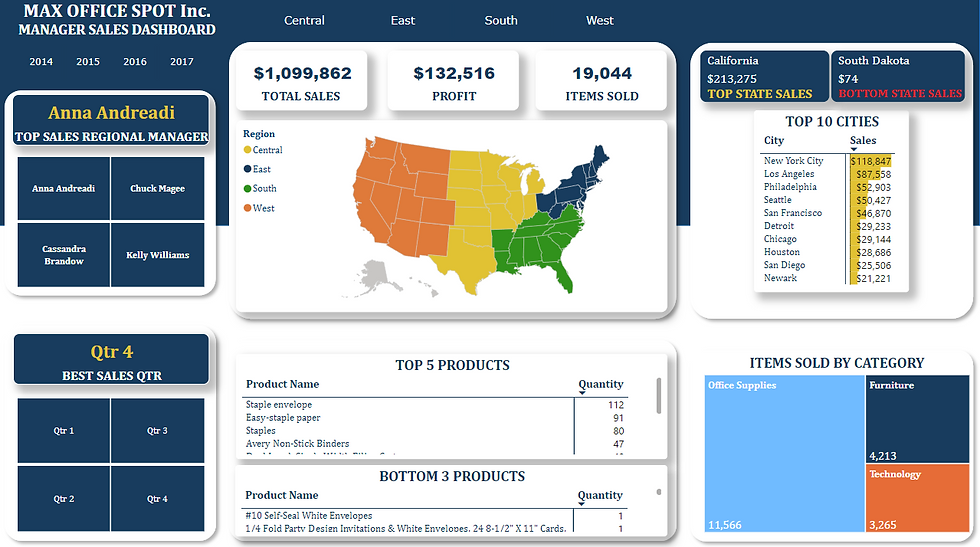
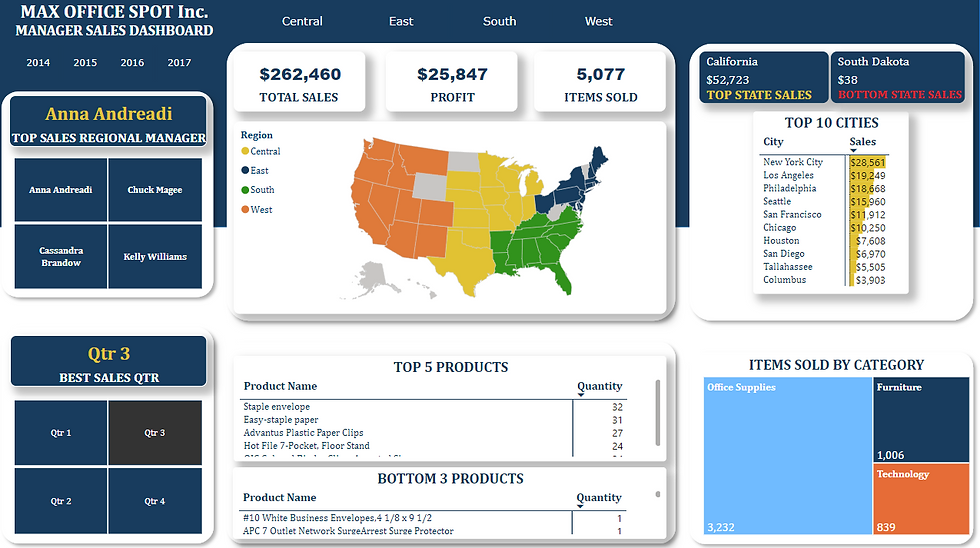
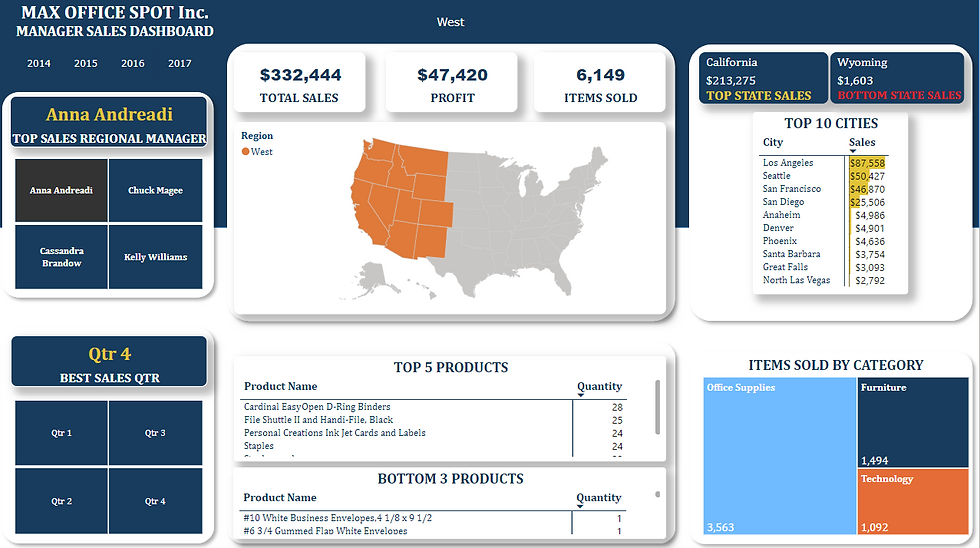
Max Office Store Inc.
This is a dashboard recently created. Here, you can get a clear view of the company's sales, profit, quantity sold, top items, and rock star managers.
While building this, I thought about what would be important for me to know about business. I need a quick reference dashboard that shows me everything I need to know as a business owner.
What area do I need to work on?
Which employees are excelling, and in what regions?
Which manager do I need to focus on and help grow?
Also what products are selling and making me profit?
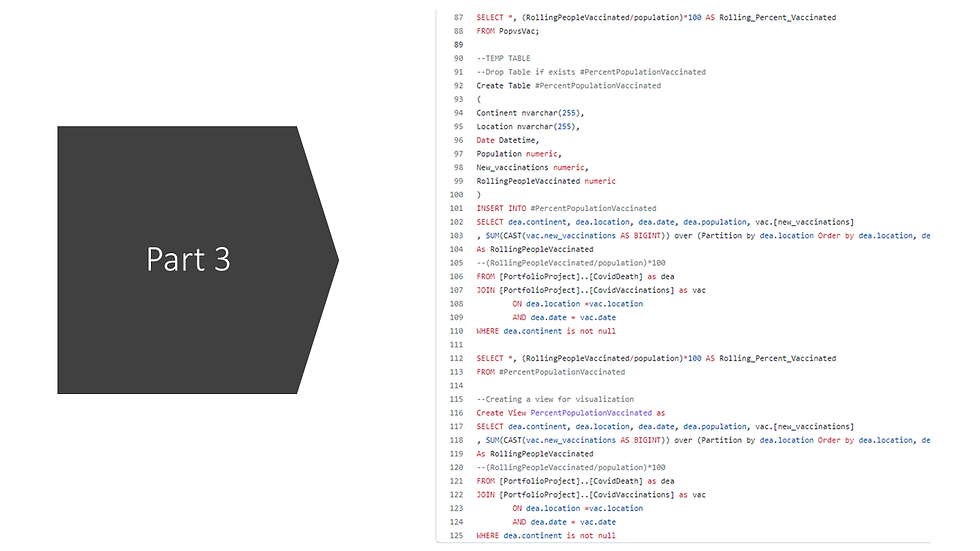
Covid19 Data Analysis Using SQL
Updated Analysis on Current Pandemic
Worked with COVID19 datasets published on Kaggle. Importing COVID19 dataset and preparing it for analysis. Merged two datasets and found correlations among the data. Visualized the analysis results using Tableau.


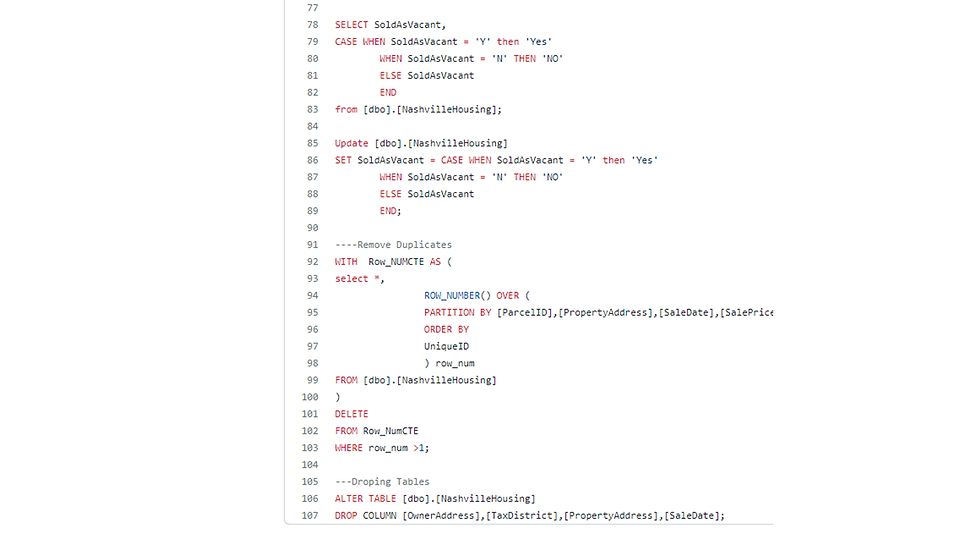
Nashville Cleaning Data Using SQL
Small Data-set Featuring Nashville Tennessee Housing
Downloaded a dataset from Kaggle pertaining to Nashville’s housing. Reviewed the data and cleaned it using SQL. You can see the techniques used by visiting the Github profile provided.


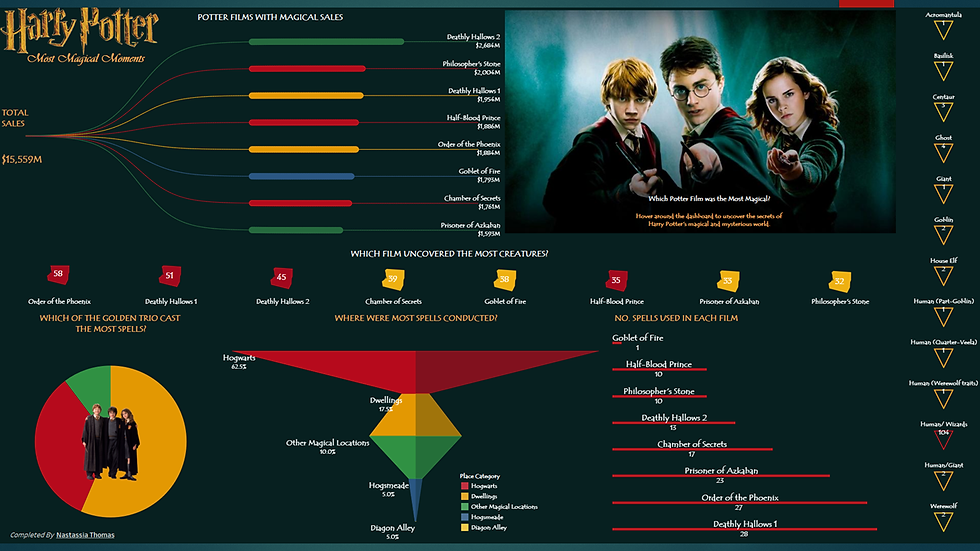
Harry Potter Magic Challenge
Hosted by Maven Analytics
Conducted a Data Analysis on structured data provided by Maven Analytics. Created the visualization dashboard using Tableau Public.


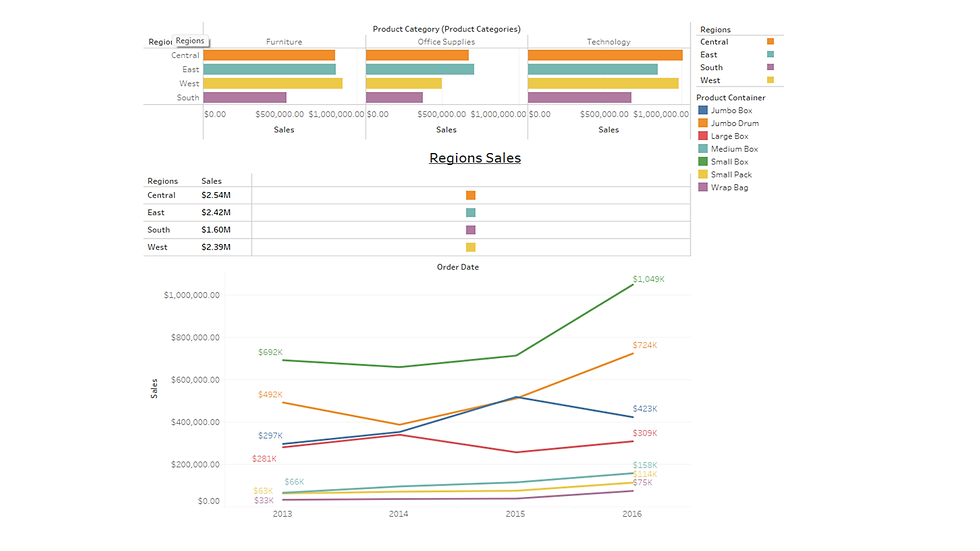
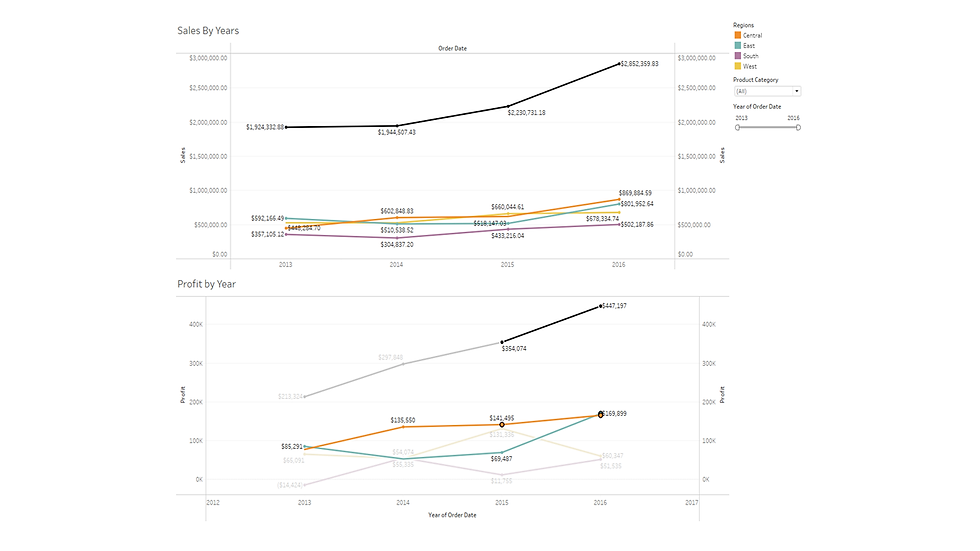
Store Dashboard Region Sales
5 Dashboards Featured on Tableau
Use relational dataset and analyze the different correlations of the regional sales. Express the profit by categories and order dates. This is visible on the Tableau. I have 5 different dashboards for this project enclosing important elements of the data.